Discuss.FOLIO.org is no longer used. This is a static snapshot of the website as of February 14, 2023.

eUsage: Requirements for e-resource usage statistics

annikaschroeer
30 Oct '18

As part of the ERM work, in Leipzig we are developing the eUsage app for handling COUNTER statistics on e-resources. See our FOLIO wiki page for more information on the data model and wireframes: https://wiki.folio.org/display/RM/eUsage.
I also demoed the current state of the app in the last ERM SubSIG meeting on Oct 24th, if you like to see it in action (recording: https://drive.google.com/drive/folders/17-AAS8JPMF77MIeRdDCqkIeD0ZO-WWP0, starting at about 24:00 - after a small fight with zoom, sorry :roll_eyes:).

We are currently working on (and have nearly finished) automatically harvesting COUNTER reports via SUSHI and storing them as they are, enriched with metadata on vendor, platform, report type, report month etc. This metadata, vendor and platform, is the link to the e-resources agreements stored in ERM, and from those to the financial details needed for some statistics.

Our next steps will be to

  1. calculate and display basic statistics, viewable from the ERM app
  2. enter basic usage data for non-COUNTER vendors (to be stored along with the harvested/uploaded reports)

For b) there will be a separate discuss post in some time, because there are many different aspects to be considered and decisions to be made. For a) I’d like to ask you for feedback and requirements now.

1. An impression of what it might look like

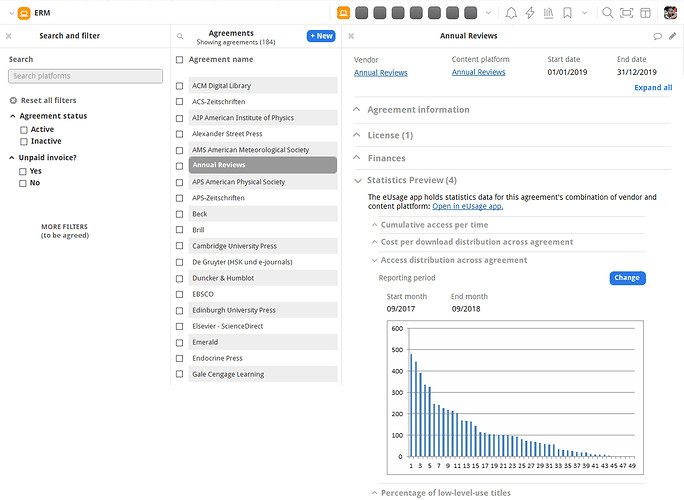
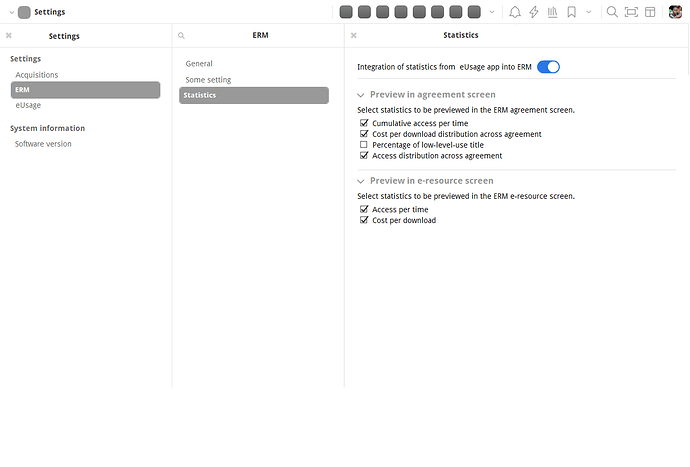
Our first ideas are to add a “statistics preview” accordion to ERM agreement- and e-resource screens. This area will display visualizations of calculated agreement or title statistics. There will be a certain number of predefined statistics (technically implemented as small plug-ins), from which each library can choose the relevant ones in the ERM setting area.

We have a wireframe for each:

ERM statistics preview

Configuration:

What do you think about the UI? Is this useful, the right place, what’s missing?

2. The statistics - what do you need?

The following statistics are the most important requirements from UB Leipzig staff - this will most certainly not be all that anyone can think of.

Agreement based:

  • Cumulative access per time
    • An overview of how access to all title of the agreement changes during the year.
  • Cost per download distribution across agreement
    • Are there some titles with special costs per download, is there an even distribution across the agreement? (This report needs individual prices for the single titles of an agreement.)
  • Access distribution across agreement
    • Is this an agreement with a small number of heavily used titles and a long list of low-level-use titles? Or is it an even distribution? Maybe it’s worth to consider licensing the important titles as single licenses instead.
  • Percentage of low-level-use titles
    • The same use-case as before: is there a small or large number of not-so-valuable titles in an agreement? Is it worth licensing the bundle of titles ir would it be better to go for individual licenses?

E-resource based:

  • Access per time
    • Simple change of access during the year
  • Cost per download

What else is there? What do you need?

We’ll also be very happy about any help with the phrasing, as non-native speaker it’s hard to get the right terms :thinking:

Thanks for reading, I’m excited for your input :smiley:

Sally
31 Oct '18
  • Absolutely need to be able to search by title. Access may be across several vendors and a title search reveals all of them with one query.

  • Need an easily downloadable excel document!

  • Document must be easy to sort. For example: a selector is looking for the lowest use titles as candidates for cancellation.

Sally
31 Oct '18
  • It is important that FOLIO handle diacritics in a COUNTER report.

  • How will it handle duplicates? One of our vendors had reports so replete with duplicates it was too much to correct manually.

  • How will FOLIO handle extra tabs, blank rows in a vendor supplied report? This happens quite frequently!

  • MUST have informative error messages, especially for manually uploaded reports! “Internal error, please try again” is unacceptable! We need to know where the error is so we know what to fix.

  • For multiple manually uploaded reports, make it so the run date can be the same for each report.

  • Will it be on track to get the next-gen version of COUNTER so that the JR5 can be harvested? JR5 is year of publication and is helpful to selectors who are considering purchasing the backfile.

kmarti
1 Nov '18

The general screens look good. I think perhaps rather than “Cumulative access per time” you could say “Downloads by Time Period.” I assuming you could select the time period for display? For something like a database, it could be “Record views by Time Period.” Or you could use a generic “Use by Time Period” but then in the report indicate what the particular use is (e.g., unique successful full-text article requests, or record views, etc.)

If you were to display the graph in ERM, I am not sure what X axis is. Is it supposed to be number of uses each month? Or is it usage by title? I think the titles would need to be listed below.

I agree with Sally that being able to see usage for a title across multiple platforms is very helpful, and it’s also interesting to see what platform is garnering the most use. If the title is linked up to usage data appropriately, you can match up this information. I know from experience this can be very challenging.

I think the biggest question I have is making sure that the Reporting SIG is aware of the data you are collecting so that they can help out as needed. A lot of reports from an ERM perspective end up combining COUNTER data with acquisitions data, to get that cost-per-download or as we oftentime shorten to cost-per-use. If the COUNTER data goes into the larger data warehouse, it could be particularly helpful for planning collections strategy as a whole, and not just limiting it to electronic resources or to evaluating a single package. The Reporting SIG may also be working on ways for delivering data, so that you don’t have do as much work within eUsage.

The

NicoleTrujillo
5 Nov '18

I agree with all of the comments above.

We often combined COUNTER data with non-COUNTER data, so making that process easier is something I would love to see. Ideas, some of which have been mentioned above, include making sure this app can seamlessly sync with data in reporting, offering an api to allow the data to go into any data warehouse, being able to insert script to transform the data before being loaded, easy excel downloads.

ehartnett
6 Nov '18

As I mentioned on the call a couple of weeks ago, I’m excited to see the progress being made with the eUsage app and like the look of the screens.

In regards to Cost per download distribution across agreement you state that “This report needs individual prices for the single titles of an agreement.” Will the app be able to accommodate those packages where we pay individually for a list of subscribed titles but then pay a package fee for a group of others?

Sally
7 Nov '18

I would like to see the ability to build customized reports, such as creating a list of turnaways greater than X for not just one, but multiple providers.

It is important to create and save the queries for those unique reports. And put them where they are easily found. I suspect many selectors will only do this once or twice a year so we need a system that is easy to pick up after a long time lapse.

Have a place to access the print holdings collection as well as limit the list to titles that have circulated.

Be able to see the results as you build a query so you can see if you’re on the right track. And easily modify it as you go along. Once you see a preview of results, then request a document download.

Always keep in mind that the meaning behind query language such as “is between” “null” “not null” “in top” “in bottom” “is prompted” may elude some Humanities majors such as myself!

scolglaz
7 Nov '18

Beyond what has already been said …
A type of usage stats we make use of is based on the COUNTER JR5: “These reports show you the number of monthly requests for each title and year of publication directly from a selected publisher over a selected period of time in the COUNTER JR5 report format.”
It would be great if the JR5 could also be incorporated into the module so that its data could be viewed and cross-referenced with other data, like the JR1 reports of the different vendors/platforms where a given title is also accessible.
Also if a way to keep track of platform changes by vendor/publisher could be included. This can be especially tricky when the vendor/publisher changes platforms mid-year and so the platform name changes in the COUNTER report, etc. and then depending on how one is looking at the usage for a given year for a given title it can appear as if a title has not had hardly any use because only a few months are actually represented.

Referring back to some of the items Sally listed, besides how will it handle duplicates, how will it handle blanks–that is, when usage for a given month is left blank rather than having the value 0 (zero) for no use but it could also mean the data is simply missing? When data is missing is the number of months reduced when calculating average usage for the year? In contrast when it is indicated that there was no usage …
Also regarding providing informative error messages, could something like the USUS.org’s validation tool for JR1 etc be incorporated or borrowed from?

Nancy_Finn
8 Nov '18

I would suggest that whenever possible use COUNTER standard language/phrasing; it is the standard and it is what we know. Keep up the good work! nrf

annikaschroeer
9 Nov '18

Hi @Sally, @kmarti, @NicoleTrujillo, @ehartnett, @scolglaz and @Nancy_Finn - thank you so much for all of your feedback, ideas and requirements! This is very valuable input for us.
I’ll come back to some of your posts in detail later, just wanted to say thank you so far!

Any other comments and ideas are still absolutely welcome :pencil2::page_facing_up:

Sally
9 Nov '18

Have a workflow in place for getting stats when the SUSHI harvest fails (and it will - as of June were were notified by PQ that “The vast majority of these [harvesting] errors occur for providers that are hosted on the publishing platform Atypon.”)

So now in November, we still don’t have stats for many Atypon clients because the SUSHI harvest issue is unresolved. See the Atypon client directory to get a taste of how many are involved https://www.atypon.com/customers/client-directory/

scolglaz
9 Nov '18

Hi Annika, you wrote: We’ll also be very happy about any help with the phrasing, as non-native speaker it’s hard to get the right terms.
FYI I am a bilingual speaker of German and English and am happy to help where I can with such things. Just let me know.

Claudius
12 Nov '18

Hello, I like the UI. Some remarks:

  • I also do think that it is important to make sure that all the data goes to the reporting data warehouse.
  • From my experience, it is more important that you can download the raw data you need in detail eg to Excel than to have a lot of predefined in-app-analyses. A few standard views are fine, though.
  • Besides the statistics on agreement level, there are two more levels of aggregation we need: As mentioned before, usage statistics for single titles are very important for collection assessment. On the other hand, for standard reports there will be a need to bring all e-resource usage to one single figure, alongside the use of the print collection. This would mean to define rules by which reports from different sources can be made commensurable.
Sally
12 Nov '18

For non-COUNTER reports from the vendor, it is important to protect patron privacy by stripping away all patron-identifying information such as email addresses, names, etc. IP addresses need to be included in a truncated form so as not to point to a specific patron but will tell a selector which campus the user is coming from. Keeping the first two sections of an IP address would be ideal. (Cornell University has the Ithaca, NY campus and the Med School in NYC as well as the Med school in Qatar. We need to know how much Med is using a resource so that a selector can ask for funds toward the cost.)

larher
21 Nov '18

(Lars-Håkan, Chalmers): I totally agree with Claudius that “it is more important that you can download the raw data you need in detail eg to Excel than to have a lot of predefined in-app-analyses. A few standard views are fine, though”.
I.e. I want to be able to view/download the Counter reports as they are, not preformatted as in Intota.

Birte
17 Dec '18

It might not always be clear where the part of an e-resource that is relevant for statistics will be stored in the FOLIO ERM structure.
Example: A single e-book could be an agreement (single purchase with its own license), an agreement line (e. g. as part of an e-book package) or an e-resource (if several packages or resources are aggregated in an agreement). The same applies to journals.
At the same time, different levels of aggregation are of interest for the statistics view: single resource statistics, package statistics and platform statistics.
So the eUsage app needs to support the attribution of statistical data to different hierarchical levels: the harvesting and viewing needs to be possible on e-resource, agreement line and agreement level, and it might even be desirable to put together statistics over several agreements (for example to see a platform statistic even though the products are stored as single agreements because they each have their own license).

This comment came up when some of the German FOLIO members tried to sort their products into the FOLIO ERM structure of agreement, agreement line, e-resource and license. There is some (intended) flexibility in this structure, so different institutions might use it in different ways.

fhemme
8 Jan '19

Maybe post v1, but could eUsage have OpenRefine build in? So that one could send the raw data to OR, edit it there / doing analysis and exporting it as .csv, .xslx or other supported formats?

cc @annikaschroeer @Bjorn_Muschall

jvoss
11 Apr '19

I realize I’m late to the conversation here, but I just saw the recording of the March 27th session on YouTube. I have a question: Will the tool have any sort of basic data validation built in? I don’t mean when SUSHI actually fails, but when the data contained within the reports are suspect and require troubleshooting with the content provider. We often see reports that are almost zero, or 10 times the same month last year, or that have suspiciously many (or few) titles used. Those trigger us to reach out to the vendor. Sometimes no one knows what happened, but sometimes this is a trigger that notifies us that our account configuration or the vendor’s system has changed somehow, and we need to fix it and re-run the report. It would be really useful to have some rudimentary checking built in, rather than pulling data out to do it manually or (worse) discovering it in the middle of using the data for a collections decision.

annikaschroeer
18 Apr '19

Thanks for the input! Yes, we experience the same kind of problems. In addition, there sometimes is suspiciously high usage that seems to result from automatic downloads by e.g. reference management software. Our plan is to have a modular, extensible design of the app. The basic functionalities we are going to provide in the first iterations, will not support those validation or refinement tools. But in the long run these functionalities are part of the concept.